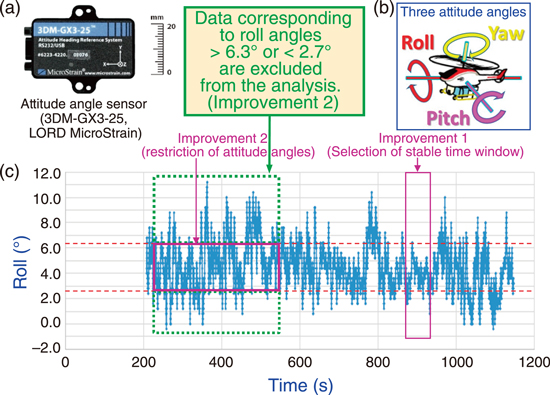
Fig.1-29 Additional functions to the measurement system: attitude angle sensor
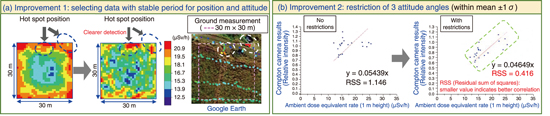
Fig.1-30 Examples of improvement of the analysis method
Unmanned helicopters that can quickly move and take measurements over a wide area from the sky are expected to be used to accurately grasp the contamination status of radioactive materials released widely by the accident at TEPCO’s Fukushima Daiichi NPS and to improve the efficiency of decontamination work. A Compton camera that can visualize the contamination distribution has often been used for measurements on the ground. We developed a Compton camera measurement system mounted on an unmanned helicopter and performed a measurement test in an area with a high dose rate in Fukushima Prefecture. The incident angle of radiation is important in the measurement by the Compton camera; however, there was a problem that the measurement accuracy deteriorated because of the instability of its posture in the sky under strong wind conditions. Therefore, we focused on the characteristics of autonomous-type unmanned helicopters that can rapidly return to the programmed position against sudden wind. We tried to improve the accuracy of hot-spot detection by adding new equipment (the attitude angles sensor (Fig.1-29), etc.) to the Compton camera system for recording the flight conditions better.
The Compton camera system mounted on an unmanned helicopter R-MAX G-I was tested at a field in Okuma, Fukushima Prefecture. Measurements (duration: about 15 min) were performed during hovering flight, in which gamma-ray source images were recorded from fixed positions about 20 m above the hot spots identified from previous ground measurements.
Based on the results, we obtained the distribution of the ambient dose equivalent rate at a height of 1 m and compared it with the values of ground-level measurement using survey meters. During the 15-min flight, the attitude angles were sometimes greatly disturbed (Fig.1-29(c)). Therefore, to identify the radiation source position more accurately, we implemented the following two improvements.
Improvement 1: Use of data for about 1 min (Fig.1-29(c), 870–934 s) in which the posture was relatively stable, instead of using all the measurement data throughout 15 min. This enabled a clearer recognition of the hot spots in the upper right of the area (Fig.1-30(a)).
Improvement 2: Even during the period when the posture was unstable (Fig.1-29(c), 224–546 s), use of only the data within the stable range of the three attitude angles enabled clearer recognition of the hot spots. The residual sum of squares (RSS), an indicator of the correlation between the aerial and ground-level measurement results, decreases as the distribution of the plots approaches the regression line (i.e., the correlation is better) over the entire dose rate range. The decrease in the RSS from 1.15 to 0.42 with improvement 2 (Fig.1-30(b)) indicates the improvement in the correlation. Good linearity in dose conversion leads to good reproducibility of ground-level values. Since reproducibility up to a high-dose-rate range is important for hot-spot detection, the improvement 2 resulted in improved hot-spot detection accuracy.
The accuracy of hot-spot detection and that of ambient dose equivalent rate distribution measurement were improved by incorporating data selection considering the flight conditions into the analysis. These results are expected to be utilized in future aerial hot-spot detection and contamination distribution measurement.
(Yoshiaki Shikaze)

