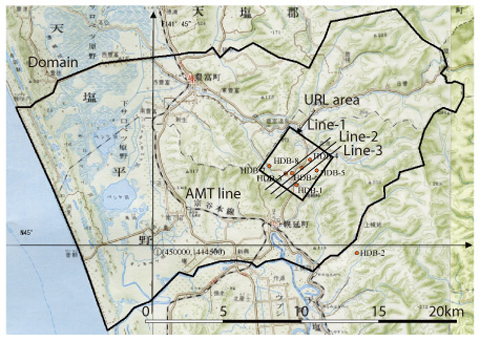
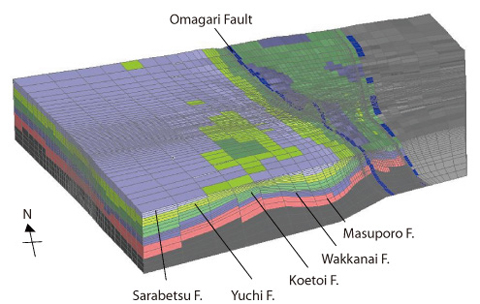
Fig.2-19 Analyzed area(upper) and the finite element (FE) mesh (lower)
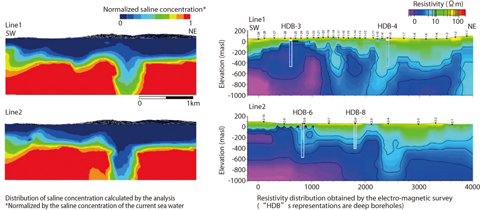
Fig.2-20 Distribution of saline concentration calculated by the GW flow and saline transport analysis (left) and resistivity distribution obtained by the electro-magnetic (EM) survey (right)
In order to understand a deep groundwater (GW) flow system, a GW flow analysis is often performed based on investigations providing the distribution of hydraulic parameters and boundary conditions. The result of this analysis is generally evaluated by comparison with measured hydraulic pressures. However, it is not effective in an area where the range of distribution of hydraulic pressure is small like Horonobe area.
Deep GW in Horonobe area has high salinity which indicates that it is old seawater confined during sedimentation. Therefore, GW flow and saline transport analysis was performed and the result was compared with measured saline concentration and distribution of resistivity which is considered to reflect the distribution of saline concentration.
In a geological environment such as this, where GW highly influences distribution of saline concentration, this analytical method focusing on the saline concentration is effective in evaluating the GW flow system.