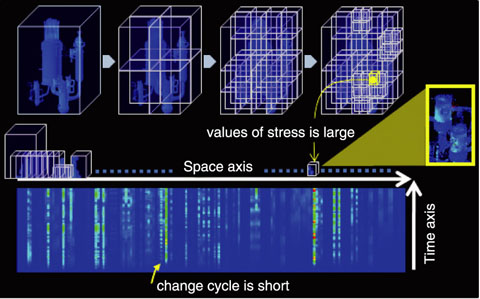
Fig.10-5 Visualization of results obtained from a vibration simulation of a nuclear facility
“Homer sometimes nods.” This kind of experience is familiar to everybody. However, in the atomic energy research field, it is important to avoid overlooking valuable information during the design, construction, operation, and inspection of nuclear facilities. We are trying to develop a visualization technique to simultaneously capture temporal and spatial fluctuations in order to prevent important information in experimental and numerical simulation results from being overlooked.
This report describes our visualization technique by considering its application to a vibration simulation of a nuclear facility after an earthquake. The simulation was conducted by the Center for Computational Science & e-Systems (CCSE). It was carried out to detect where in the nuclear facility a comparatively large stress was caused. From the simulation results, it is necessary, but difficult, to find answers to the questions “when,” “where,” and “what” for an event occurring in the nuclear facility. Therefore, we propose a technique in which time and space, corresponding to “when” and “where” respectively, are projected onto the frame of a plane (visualization plane) and each phenomenon corresponding to “what” is graphically represented in the plane.
The projection of time and space onto the frame requires the projection of three-dimensional space onto one axis. We propose a projection method to represent three-dimensional space as an arrangement of small hexahedrons in one line (space axis); the method involves the use of an octree. Here, the accuracy required for the analysis can be obtained by adjusting the number of subdivisions according to the features of the data (upper part of Fig.10-5). Next, we define a time axis perpendicular to the space axis, and these two axes form a two-dimensional space-time plane (visualization plane). The stress distribution map is generated in terms of space and time by plotting the stress values obtained from the vibration simulation (lower part of Fig.10-5).
In this map, we identified the time and space with a comparatively large stress, and they corresponded to the point of intersection of pipes. Moreover, we understood that the stress is caused at an early stage after the occurrence of the earthquake and that the stress thereafter fluctuates with the passage of time.
By using our technique, we can find parts that are susceptible to an earthquake, without there being a risk of their being overlooked, and suggest improvements for the safety of the nuclear facility, for example, the reinforcement of such parts.
It is expected that our technique will also be applicable to various experiments and simulations that involve parameters with spatiotemporal fluctuations, such as thermal fluctuations and stress fluctuations.

