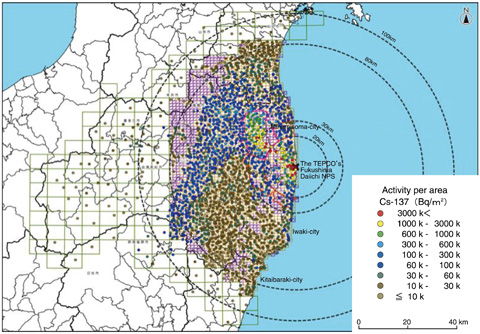
Fig.1-10 Cs-137 deposition map
In the accident at the TEPCO’s Fukushima Daiichi NPS, large amounts of radionuclides were released into the atmosphere and deposited on ground over wide areas. To properly estimate the effects of released radionuclides on the environment and on human health over long time periods and implement appropriate countermeasures, it is necessary to obtain detailed information about regional distribution of deposited radionuclides and dose rates in air. Since the accident occurred, a large number of environmental monitoring data have been accumulated by many organizations, including the Ministry of Education, Sports, Science and Technology (MEXT). However, variations in method, accuracy, location, and dates exist between different sets of monitoring data, making it difficult to integrate the data into maps.
Considering these factors, both MEXT and researchers suggested that radionuclide deposition maps should be constructed as soon as possible based on reliable and large-scale monitoring activities. Thus, JAEA conducted a mapping project in collaboration with many universities and research institutes. More than 400 people took part in soil sample collection and more than 300 people participated in analysis of the collected samples.
Radionuclide deposition maps were constructed for Cs-137, Cs-134, I-131, Te-129 m, Ag-110 m, Pu-238, Pu-239+240, Sr-89, and Sr-90 according to analyses of soil samples collected at about 2200 locations. Furthermore, a dose rate distribution map at 1 m height (based on measurements at soil sampling locations) and dose rate distribution maps for roads based on carborne surveys conducted over 17000 km were also prepared.
Fig.1-10 presents the completed Cs-137 deposition map, indicating Cs-137 activity per ground area (Bq/m2). It is clear that the region to the northwest of the Fukushima site is highly contaminated and that the middle part of Fukushima Prefecture (referred to as Nakadori) is highly contaminated. Furthermore, we were able to construct a novel I-131 deposition map, even though statistically significant data were obtained for I-131 at fewer locations than for cesium.
These maps have been utilized as basic data to evaluate the consequences of the accident and related countermeasures. JAEA will continue to manage a database, which will keep the obtained data secure; JAEA will also provide the data in desired formats and contribute to the investigation of countermeasures.
The work was implemented under commission of the Ministry of Education, Culture, Sports, Science and Technology of Japan (MEXT).

