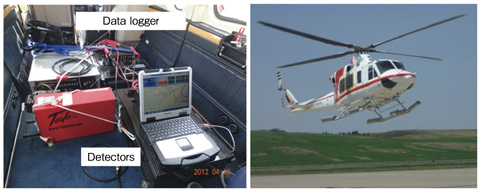
Fig.1-11 Airborne radiation monitoring system
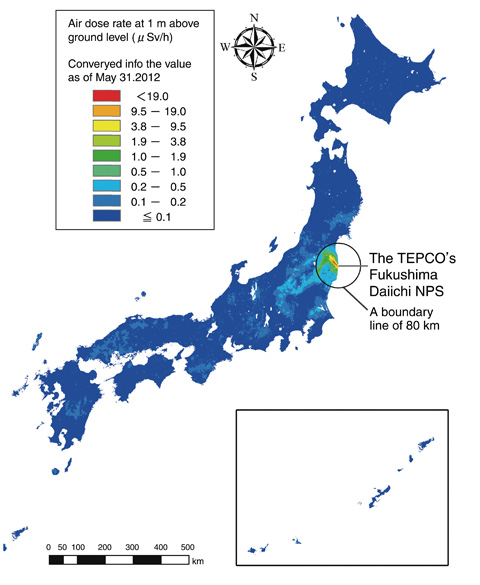
Fig.1-12 Radiation dose map for the whole of Japan
Since the accident at the TEPCO’s Fukushima Daiichi NPS (1F), a method of environmental radiation monitoring that can quickly measure large areas has been required. It is also desirable for the results of this monitoring to be visualized. We conducted monitoring of the radiation in conjunction with JAEA, using a plane (helicopter) to grasp the full extent of the effects of the accident.
For this airborne radiation monitoring, we installed large detectors for γ-rays (NaI detectors) on a helicopter and measured the count rate of γ-rays, which we synchronized with the location and altitude information collected by GPS (Fig.1-11). The survey was conducted at 3 km intervals in eastern Japan (1.8 km intervals in the vicinity of 1F and at 5 km intervals in western Japan and Hokkaido. The data we gathered in this manner were compared with the data measured on the ground; then, we corrected for the influence of factors such as altitude and converted the data into dose rates at 1 m above ground level. We deducted background natural radionuclides based on an energy spectrum of the gamma beam that we measured at the same time; we were also able to convert the dose rate into rates of radiocesium deposition (Bq/m2).
The dose rate map is shown in Fig.1-12. Because measurement days vary according to location, an equivalence map (dose rate and radiocesium) was created as a result of applying decay correction to data from May 31, 2012. A high-dose area was found to extend from 1F in the northwest toward Tochigi and Gunma. In addition, a relatively high-dose area was found in southern Ibaraki and northern Miyagi. It is thought that radioactive Cs released by 1F was deposited in these areas. Conversely, relatively high doses were found in the central part of Chugoku District and Kyushu. However, these areas were shown to have been influenced by the background radiation. This map is available to the public on the homepage of the Ministry of Education, Culture, Sports, Science and Technology
(http://radioactivity.mext.go.jp/ja/contents/6000/5847/view.html).
This work was carried out under a contract with the Ministry of Education, Culture, Sports, Science and Technology of Japan (MEXT) in fiscal years 2011 and 2012.

